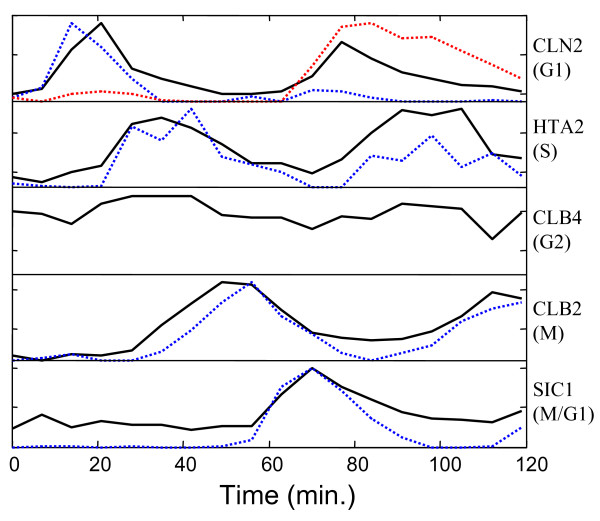
Figure 4.

Comparison of MCR-WALS extracted profiles with designated cell cycle regulated genes. Selected profile vectors (dashed lines) extracted from the Alpha-696 data set with the 8-component model are compared with the time profiles for representative genes (solid lines) selected by Lu et al. [2] for each phase of the cell cycle. Both sets of profiles are normalized to unit length. Two extracted profiles were necessary to account for each cycle of the G1 phase and no clear match was indicated for G2.
