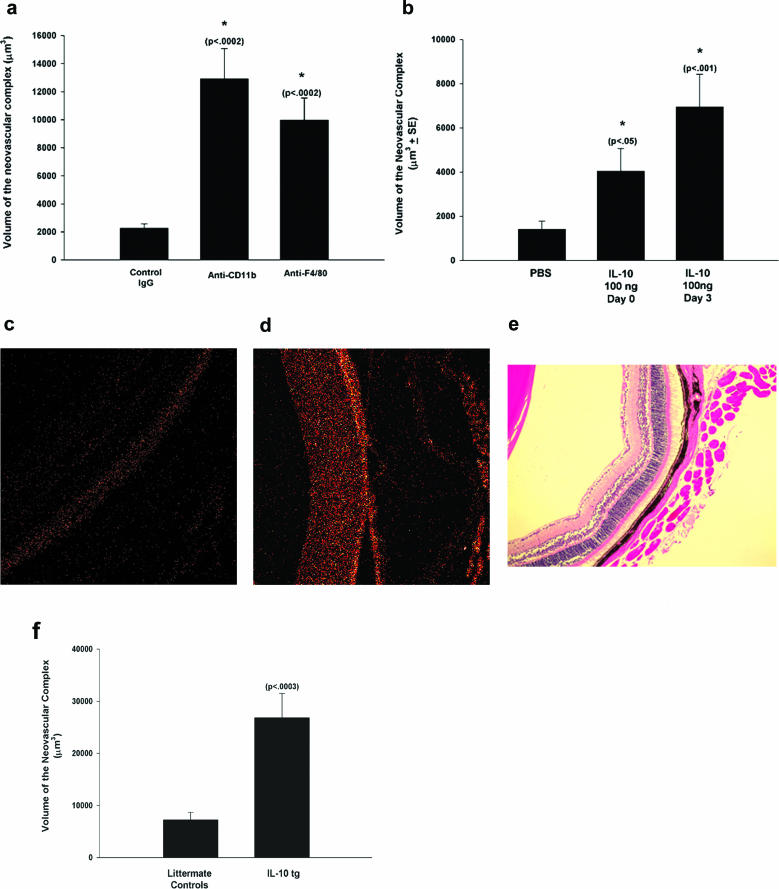
Figure 3. Inhibition of Macrophage Infiltration Promotes CNV.
(A) IL-10 −/− mice were injected with anti-CD11b (volume of the neovascular complex: 12,903.1 ± 2,171.3 μm3), anti-F4/80 (9,977.3 ± 1,572.7 μm3), or control IgG (2,262.3 ± 313.4 μm3) on days −1, 0, and +1. CNV volumes were determined on day 7.
(B) IL-10 −/− mice were injected in the vitreous with PBS (1,394 ± 382.4 μm3) or 100 ng of rIL-10 on day 0 (the day of laser treatment; 4,033.6 ± 1,026.5 μm3) or day 3 (6,949.8 ± 1,475.5 μm3).
(C and D) Cross-sections of the retinas of a control littermate (C) and a VMD2-IL-10 Tg mouse (D) stained with anti-IL-10 and examined by confocal microscopy.
(E) Hematoxylin and eosin staining of the retina of a VMD2-IL-10 Tg mouse (magnification 200×).
(F) VMD2-IL-10 Tg mice (24,428.6 ± 4,360.7 μm3) and littermate controls (6,830.1 ± 1,324.9 μm3) were subjected to laser treatment and CNV volumes were determined on day 7.
Asterisks indicate values significantly different from control; p-values are given in parentheses.

