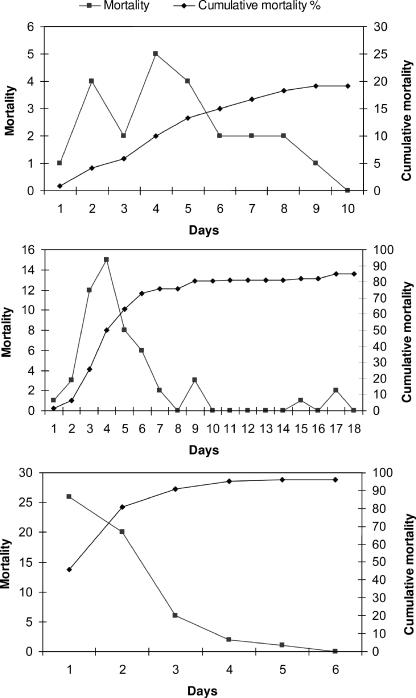
FIG. 1.
Epidemic curves of three outbreaks of Clostridium botulinum type D intoxications in three groups of unvaccinated dairy heifers and calves. The numbers of affected animals (mortality) and cumulative mortality rates (expressed as percentages) are presented day by day, commencing with the index cases and continuing to the last day of mortality. Outbreak 1 (top), outbreak 2 (center), and outbreak 3 (bottom) are described in the text.

