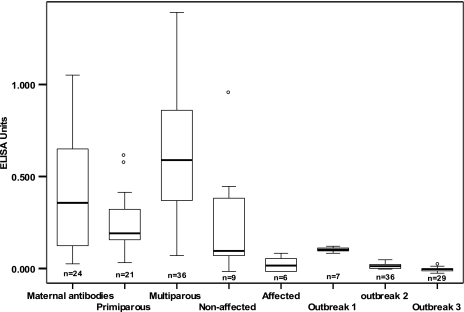
FIG. 3.
Levels of anti-botulinum neurotoxin type D IgG in serum (expressed in ELISA units) in various animal groups. The boxplot shows, from left to right, levels in preweaning calves (maternal antibodies), in primiparous and multiparous cows, in nonaffected and affected cows in outbreak 3, and in calves in outbreaks 1 through 3.

