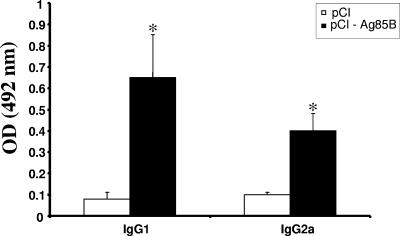
FIG. 3.
Antibody subclass response in mice following i.m. immunization with the Ag85B gene. IgG1 and IgG2a subclass levels in sera of mice (n = 10) immunized with DNA vaccine pCI-Ag85B or control plasmid pCI were determined after the third immunization (day 45). Results are expressed as means of each group immunized. Error bars indicate standard deviations of the means. Statistically significant differences to pCI control group are denoted by an asterisk (P < 0.05). OD, optical density.

