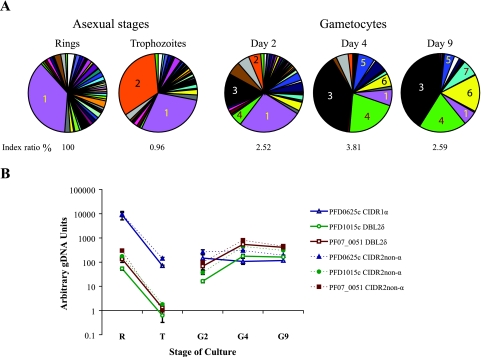
FIG. 1.
Changes in var transcript abundance upon differentiation from asexual to sexual reproduction. (A) Transcription levels were measured by real-time PCR using a set of primers that amplify 58 var genes from clone 3D7. The relative abundance of transcript from each var gene is presented as a proportion of total var transcript abundance in the parasite population tested. An index ratio is given under each chart, indicating the var transcript abundance as a percentage of the estimated total var transcript abundance in ring-stage trophozoites, the stage with peak abundance. Numbered sectors of the pie charts correspond to the following genes: 1, PFD0625c; 2, PFE1640w; 3, PF07_0051; 4, PFD1015c; 5, PFL1955w; 6, PFL1960w; and 7, PF08_0103. (B) Transcript levels of PFD0625c, PFD1015c, and PF07_0051 normalized against levels of the control seryl-tRNA synthetase gene. Triplicate real-time measurements were performed for each cDNA, and the mean values are shown. Similar results were obtained when the experiment was repeated with an independent set of 3D7a gametocyte cultures (data not shown). Error bars represent 1 standard deviation. R, ring stages; T, trophozoite stages; G, gametocyte day 2, 4, or 9 cultures; gDNA, genomic DNA. CIDR1 and DBL2 are domains within PfEMP1 proteins.

