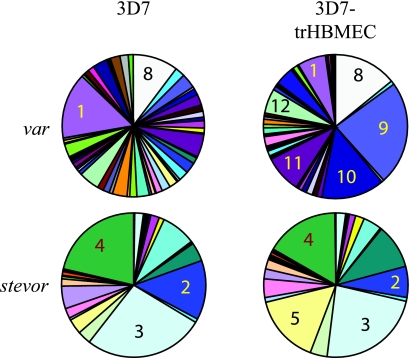
FIG. 6.
Levels of stevor transcription in trophozoite-stage parasites either before or after selection on trHBMEC. Transcript levels were measured by real-time PCR using primers specific to each of 37 stevor genes and 58 var genes from clone 3D7. The relative abundance of transcripts from each stevor or var gene is presented as a proportion of total transcript abundance for the relevant gene family in the parasite population tested. Numbered sectors of the pie charts correspond to the following genes: 1, PFD0625c; 8, PF11_0008; 9, PF13_0003; 10, PFD1235w (var genes); 2, PFI0080w; 3, PF10_0395; 4, PFF0850c; and 5, PF11_0013 (stevor genes).

