
FIG. 3.
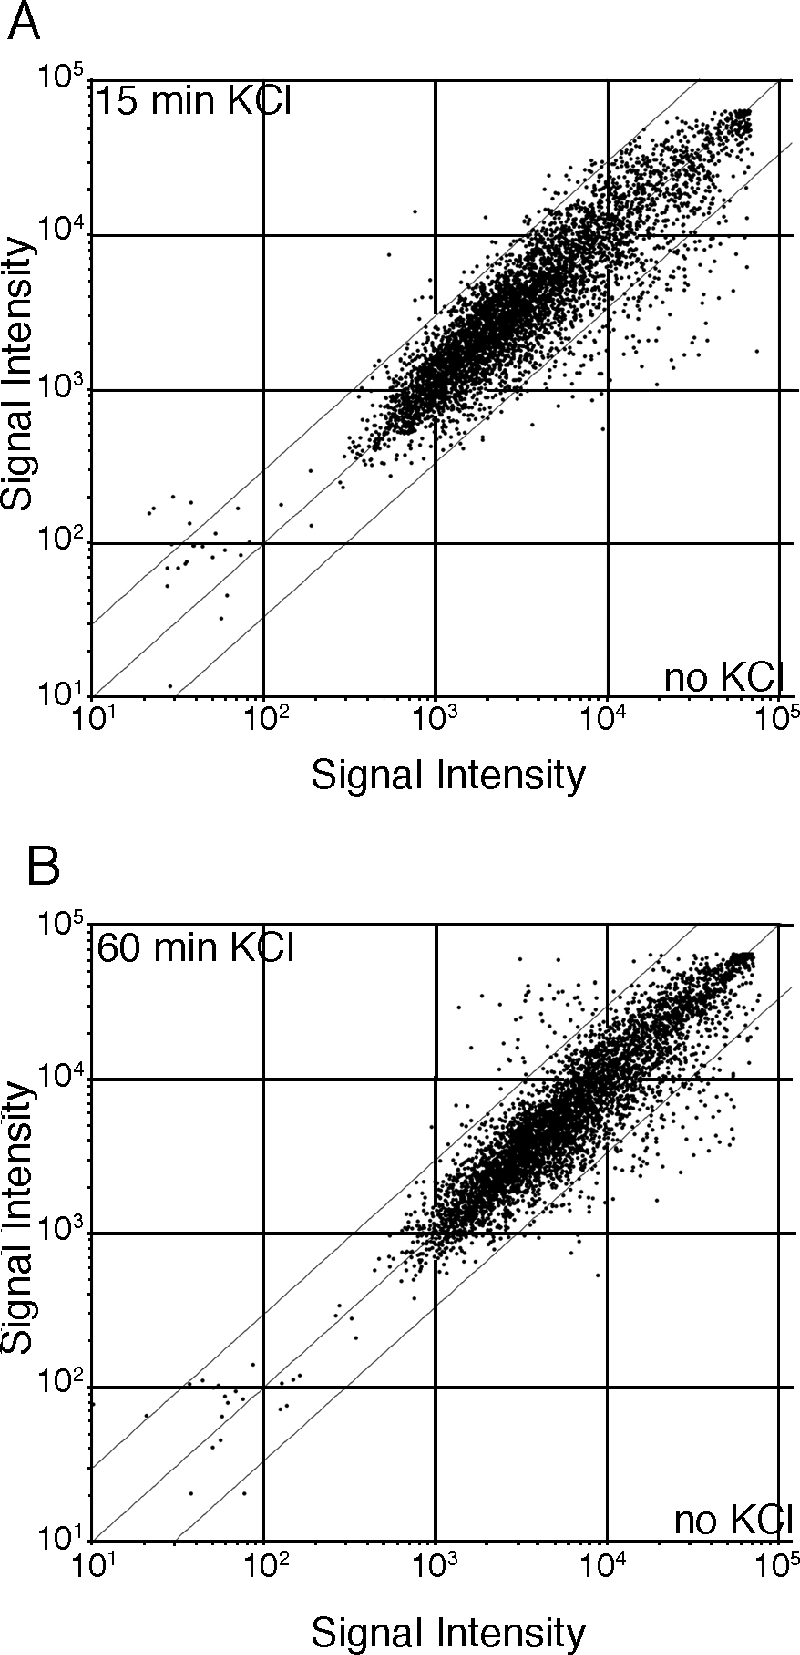
Characterization of gene expression changes during the response to 1 M KCl. (A) Gene expression changes after 15-min KCl treatment are characterized by robust down-regulation of genes. A scatter plot of DNA microarray signal intensities after 15 min of KCl stress plotted against signal intensities of nonstressed control cells is shown. The flanking diagonal lines indicate a threefold change in expression. (B) Gene expression changes after 60 min of KCl treatment are characterized by robust up- and down-regulation of genes. A scatter plot of DNA microarray signal intensities after 60 min of KCl stress plotted against signal intensities of nonstressed control cells is shown. Annotations are as shown in panel A.