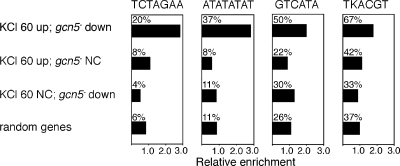
FIG. 5.
Identification of DNA sequence motifs that are specifically overrepresented in Gcn5-dependent KCl-induced genes. The bar charts show the frequency of four indicated DNA sequence motifs upstream (−800 bp from ATG) of genes within different classes relative to the genomic frequency of the motifs. The classes contain (i) 30 genes that are induced ≥2-fold after KCl treatment for 60 min, (ii) 52 genes that are induced ≥2-fold by KCl at 60 min but are not Gcn5 dependent (gcn5− NC; change in induction [n-fold] ≤ 1.1-fold), (iii) 27 genes that show reduced expression in the gcn5− mutant after 60 min of KCl treatment (≥2-fold) but are not KCl induced (KCl NC; change in induction [n-fold] ≤ 1.3-fold), and (iv) 9 × 30 randomly selected genes. The proportion (%) of genes in each class that contain each motif is indicated above the bars.

