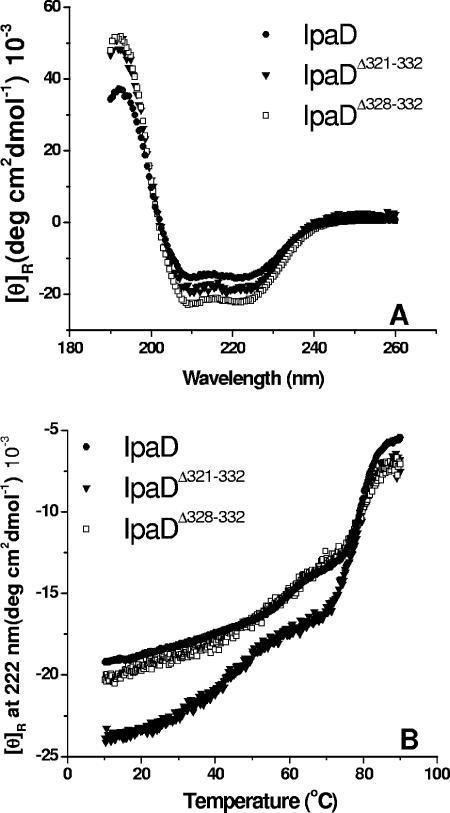
FIG. 6.
Secondary structure analysis of IpaD and IpaD mutants by CD. (A) CD spectra were collected at 10°C at a rate of 20 nm/min employing a resolution of 0.5 nm and are an average of three consecutive measurements. Protein concentrations were 0.1 mg/ml in PBS. The double minima shown are indicative of a highly α-helical protein. (B) Temperature dependence of the molar ellipticity at 222 nm was monitored from 10 to 90°C at 0.5°C intervals at a rate of 15°C/h. Protein concentrations were 0.1 mg/ml in PBS. Although the error bars have been omitted for clarity, the individual data entries have a typical uncertainty of 5% or less (n = 3).

