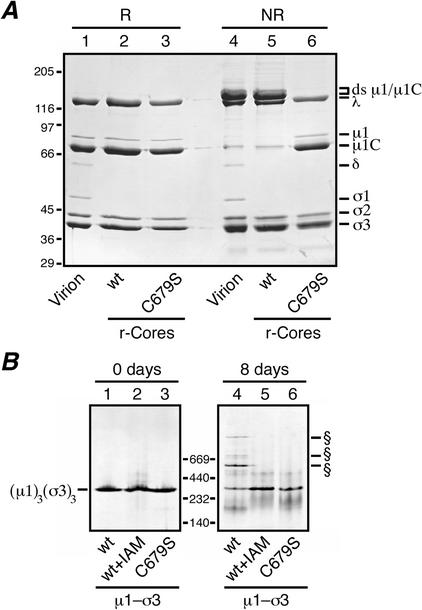
FIG. 5.
Analyses for ds bond formation with μ1 mutant C679S. (A) Recoated cores containing T1L wt σ3 and either T1L wt μ1 or the T1L μ1 mutant C679S were generated and purified, and particle concentrations were determined by densitometry. Equal amounts of the wt (lanes 2 and 5) or C679S (lanes 3 and 6) recoated cores were mixed with reducing (R) or nonreducing (NR) sample buffer, disrupted by boiling, and resolved on a mini-sized SDS-PAGE (8% acrylamide) gel. Virions disrupted under reducing (lane 1) or nonreducing (lane 4) conditions were included for comparison. Viral proteins were visualized by Coomassie staining. (B) Purified μ1-σ3 heterohexamers stored frozen in buffer with 10 mM DTT were thawed, and a small amount of each was diluted into nonreducing sample buffer and analyzed on a 4 to 15% acrylamide gradient native gel (Amersham Pharmacia Biotech) (lanes 1 to 3; 0 days). The remainder of each sample was passed through a PD-10 column to remove DTT and then stored at 4°C for 8 days at ambient conditions. At the end of that time, a small amount of each was diluted into sample buffer and analyzed on another 4 to 15% native gel (lanes 4 to 6). Three types of μ1-σ3 preparations were included in this analysis: complexes containing wt T1L μ1 and σ3 (lanes 1 and 4), complexes containing wt T1L μ1 and σ3 that were treated with 10 mM IAM to block free cysteines before storage (lanes 2 and 5), and complexes containing T1L C679S μ1 and wt T1L σ3 (lanes 3 and 6). The position of the native μ1-σ3 heterohexamer is indicated to the left. The positions of higher-Mr forms specific to the complexes containing wt T1L μ1 and σ3 (lanes 1) are indicated (§). Positions of native gel markers (Amersham Pharmacia Biotech) are indicated in kilodaltons.

