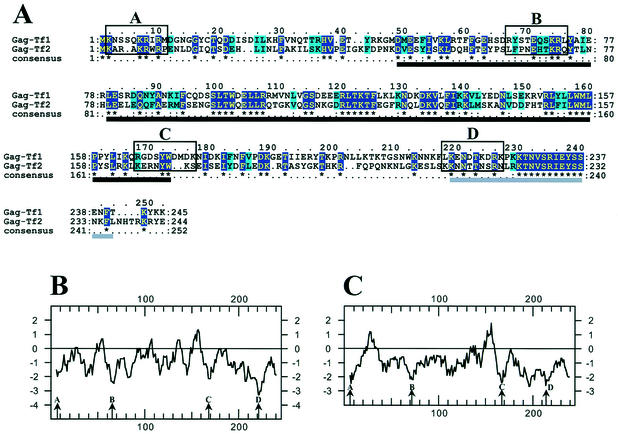
FIG. 1.
Comparative analysis of the Gag proteins of Tf1 and Tf2. (A) Clustal alignment of Gag proteins from Tf1 and Tf2. The dark blue boxes with yellow letters highlight identical amino acids, while the light blue boxes with black letters highlight similar amino acids. The four open boxes (A, B, C, and D) contain the amino acids deleted for this study. The black and gray lines under the alignment indicate the two blocks used to measure the Ks/Ka ratios (see the text). (B and C) Kyte-Doolittle hydropathy profiles of the Tf1 (B) and Tf2 (C) Gag proteins. Arrows indicate the four conserved hydrophilic domains (A, B, C, and D) targeted by the mutagenesis.

