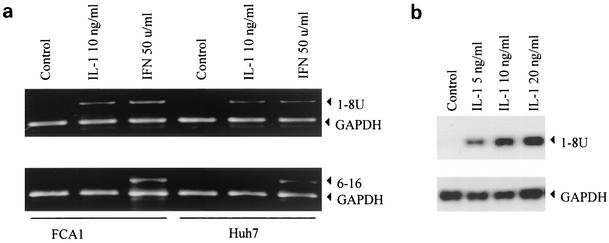
FIG. 4.
Effects of IL-1 and IFN on 1-8U and 6-16 gene expression in FCA1 and Huh7 cells. (a) The cells were treated with 10 ng of IL-1β per ml or with 50 U of IFN-α per ml for 24 h. Total RNA was extracted and used for semiquantitative reverse transcription-PCR analysis. Primers specific for the 6-16 and 1-8U genes and the GAPDH primer were used. The PCR products were resolved on 1.5% agarose gels. The positions of the gene-specific bands are indicated by arrowheads. (b) Northern blot analysis of 1-8U mRNA induction by IL-1β. FCA1 cells were treated with various doses of IL-1β for 24 h. The total RNAs were extracted for Northern blot analysis. GAPDH served as an internal control.

