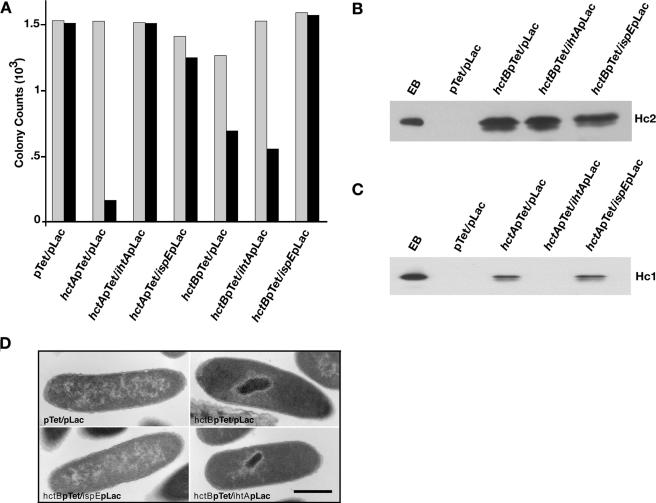
FIG. 2.
IspE but not IhtA rescues E. coli from Hc2-induced growth repression. (A) Viability assay of E. coli expressing Hc2 and rescuing clones. Cultures expressing Hc1 and rescuing clones served as a control for IspE and IhtA activity. Samples not induced for Hc1 or Hc2 expression are represented by the gray bars, and samples induced for Hc1 or Hc2 are represented by the black bars. (B) Western blot analysis of Hc2 content in E. coli coexpression. The indicated strains were induced to express IhtA (hctBpTet/ihtApLac) or IspE (hctBpTet/ispEpLac) for 2 hours. Hc2 expression was then induced for an additional 5 h. Cultures were normalized for OD550 prior to loading. C. trachomatis L2 EBs served as a reference for Hc2 position, and E. coli(pTet/pLac) cultures grown under the same conditions as above served as a negative control. (C) Western blot analysis of Hc1 content in E. coli coexpressing Hc1 and the constructs indicated above. Cultures were treated as above, and EBs served as a reference for Hc1 migration. (D) Ultrastructural analysis of E. coli induced to express vector controls (pTet/pLac), Hc2 (hctBpTet/pLac), Hc2 plus IspE (hctBpTet/ispEpLac), or Hc2 plus IhtA (hctBpTet/ihtApLac). Bar, 0.5 μm.

