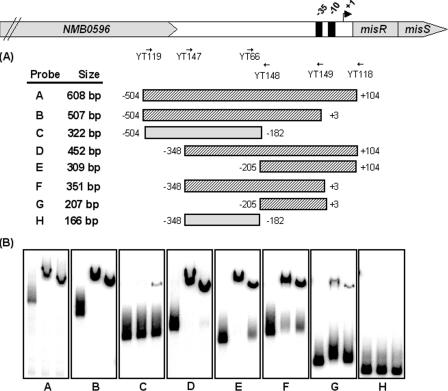
FIG. 5.
Mapping of the MisR binding site within the misR promoter region by EMSA using overlapping DNA fragments. (A) Schematic presentation of each probe used in this study with the primers used to generate these DNA fragments depicted above. Hatched boxes represent probes that are shifted by MisR, and gray boxes indicate PCR fragments that are not shifted. Numbers adjacent to the boxes indicate the endpoints of the fragment with respect to the start site of transcription. (B) In each panel, the left lane contains DNA probe only, the middle lane contains DNA probe and MisR∼P (340 pmol), and the right lane contains DNA probe and MisR (340 pmol). The binding conditions are as described in the legend to Fig. 4.

