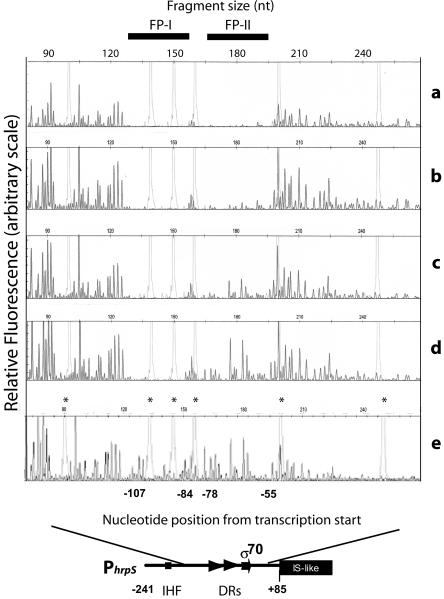
FIG. 5.
DNase I footprinting of the HrpY binding sites. DNase I digestion reactions were prepared and analyzed by capillary electrophoresis in an ABI 3770 sequencer as described in Materials and Methods. The fluorescence intensity of the 6-FAM-labeled fragments is shown on the y axis of each electropherogram, fragment sizes are given along the top in nucleotides as determined by comparison to the internal molecular weight standards (light gray peaks marked by an asterisk in the bottom electropherogram), and the coordinates of the peaks (bases) relative to the transcription start site are given along the bottom. Solid bars at the top (labeled as FP-I and FP-II) indicate PhrpS regions protected by His6-HrpY. Four electropherograms from reactions with decreasing amounts of His6-HrpY are shown: 80 μM (a) 8 μM (b), 2 μM (c), and 0.5 μM (d) HrpY. The bovine serum albumin-only control is also shown (e).

