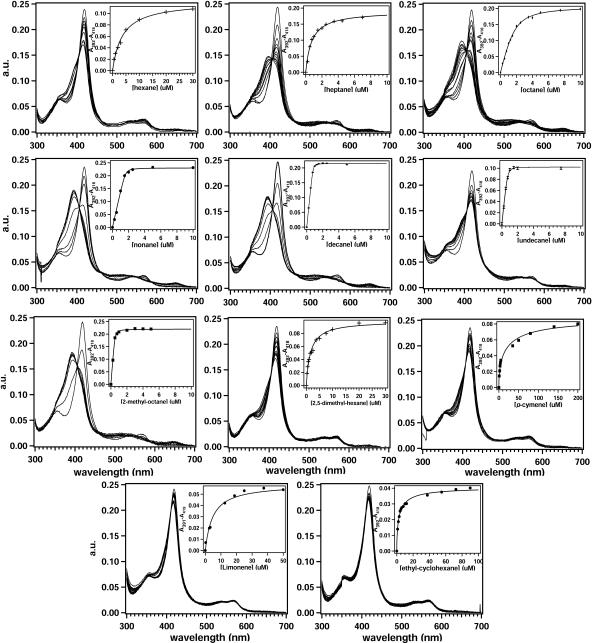
FIG. 3.
Titration curves of various alkanes: C6, first row left; C7, first row middle; C8, first row right; C9, second row left; C10, second row middle; C11, second row right; 2-methyl octane, third row left; 2,5-dimethyl hexane, third row middle; p-cymene, third row right; limonene, fourth row left; ethyl-cyclohexane, fourth row right. The inserts show the differences in absorption between A392 and A418 upon addition of micromolar concentrations (μM) of substrate and the fitted trace from which a Kd value was determined.

