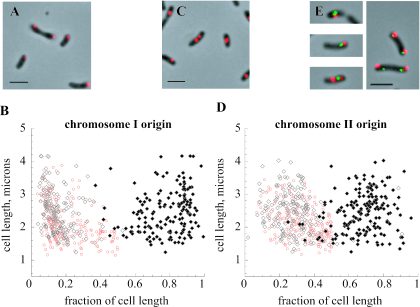
FIG. 1.
Positions of V. cholerae chromosome origins in wild-type strain N16961. (A and B) Positioning of the large chromosome origin in cells. (C and D) Positioning of the small chromosome origin. Graphs show positions of signals in cells containing one (red) or two (black) fluorescent foci; they depict the lengths of the cells on the y axis and the positions of the fluorescent foci along the length of the cell on the x axis. Photomicrographs depict the Cy3 probe signals superimposed on phase-contrast images of cell bodies. Bars, 2 μm. (E) Examples of dually labeled cells, where the oriCI probe signal is red (Cy3) and the oriCII probe signal is green (fluorescein).

