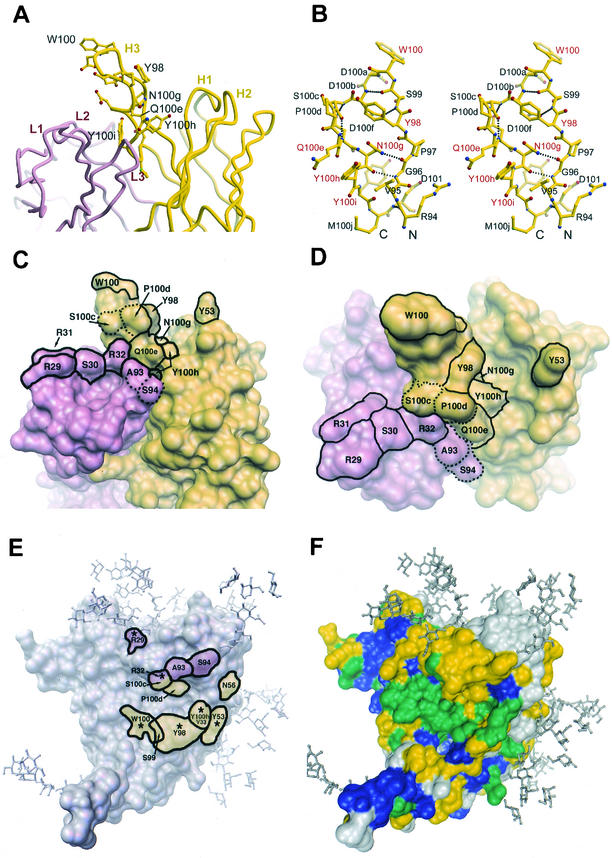
FIG.7.
Molecular features of the paratope of b12. (A) Tube diagram (36) of the combining site of Fab b12, showing the position of the protruding H3 loop relative to the other CDRs. Residues in H3 for which replacement by Ala resulted in a ≥95% decrease in apparent affinity to gp120 relative to wild-type (w.t.) b12 are labeled. (B) Stereo diagram of a ball-and-stick representation (24, 36) of the H3 loop of b12. The key residues that were labeled in A are labeled in red. (C and D) Molecular surface rendering (64, 65) of the b12 paratope (C, side view; D, top view). The light chain is colored pink, and the heavy chain is colored yellow. Residues that upon substitution caused a ≥95% decrease in apparent affinity to gp120 relative to wild-type b12 are indicated (solid outline). Note that residue Y100i is buried. Residues S100c, P100d, A93, and S94 (dotted outline) are shown for facile comparison with panel E. The b12 structure is taken from Saphire et al. (66). (E) Crystal structure of the gp120 core (39) with the residues of b12 that are predicted from the docking model (66) to be in close proximity to the outlined region on gp120. Thus, the labeled residues are those of b12, not gp120. Putative footprints in pink and yellow are from light- and heavy-chain residues, respectively. Asterisks (*) indicate the predicted contact residues that were also found to be critical for gp120 recognition by mutational analysis in this study, as defined in panels C and D. Note: a crystal structure of b12 in complex with core gp120 is as yet unavailable. (F) Sequence conservation map of core gp120 as defined by Kwong et al. (39). Residues in blue are conserved among all primate retroviruses, residues in green are conserved among all HIV-1 isolates, residues in yellow are moderately conserved among all HIV-1 isolates, and residues in grey are variable. Carbohydrate has been modeled onto the core structures (39) of gp120.

