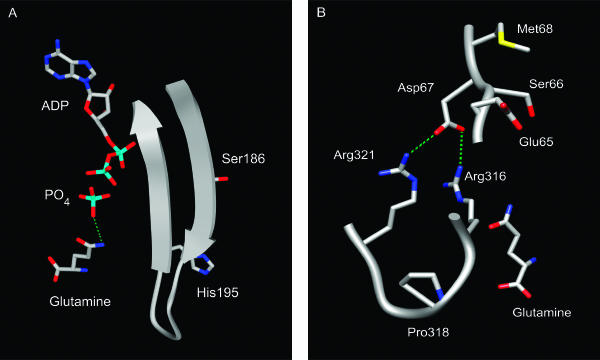
FIG. 4.
Locations of mutated residues in the homology model of GS. (A) The backbone of residues 183 to 199 is shown as a ribbon diagram. (B) The backbones for residues 65 to 68 and 316 to 321 are shown as smoothed tubes. Hydrogen bonds are shown as dashed lines. Color coding: carbon, gray; oxygen, red; nitrogen, blue; sulfur, yellow; phosphorus, cyan; hydrogen bonds, green. The diagrams were produced with UCSF Chimera (32).

