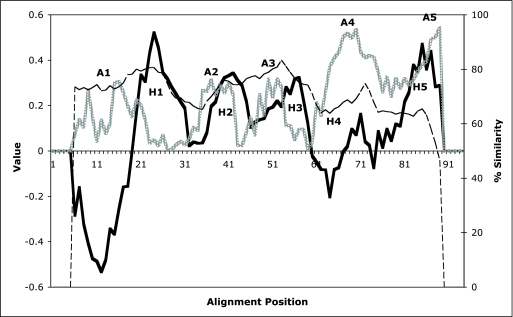
FIG. 3.
Average hydropathy, amphipathicity, and similarity plots for the AT-2 domains of the 69 AT-2 proteins included in this study. The plots were generated with the AveHas program (53). H1 to H5, five peaks of hydrophobicity; A1 to A5, five peaks of amphipathicity when the angle is set at 180° as is appropriate for a β-strand. Hydropathy, heavy solid line; amphipathicity, light dotted line; similarity, thin dashed line.

