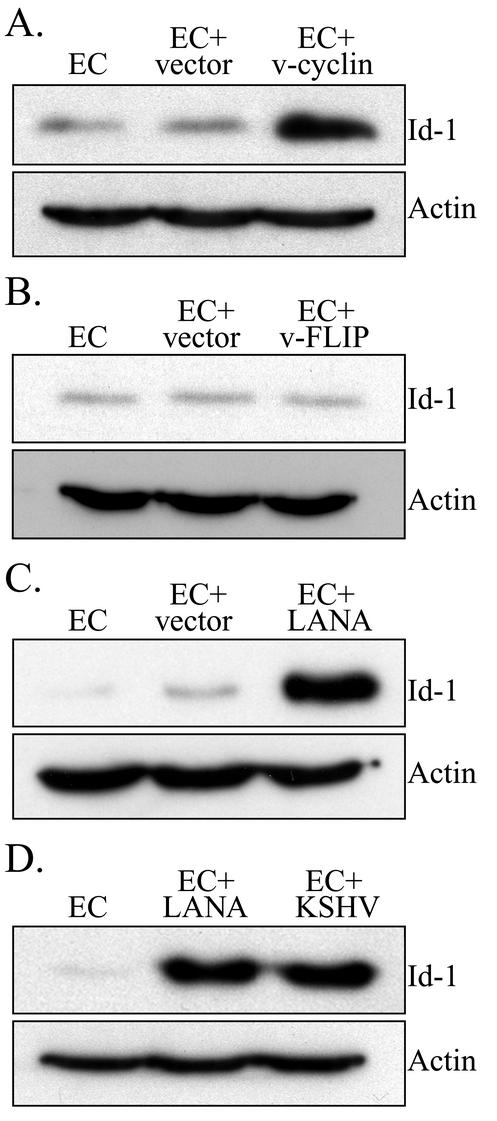
FIG. 6.
Western blot analysis for expression of Id-1 in transduced ECs. (A) Expression of Id-1 in ECs, ECs transduced with the empty LZRS retroviral vector (EC+vector), and ECs transduced with LZRS-v-cyclin. ECs transduced with the empty LZRS retroviral vector had a 0.8-fold increase in Id-1 expression compared to that in control ECs, while ECs transduced with LZRS-v-cyclin had a 7.0-fold increase compared to control ECs. (B) Expression of Id-1 in ECs, ECs transduced with the empty LZRS retroviral vector, and ECs transduced with LZRS-v-FLIP. ECs transduced with the empty LZRS retroviral vector had a 1.0-fold increase in Id-1 expression compared to that in control ECs, while ECs transduced with LZRS-v-FLIP had a 0.8-fold increase compared to control ECs. (C) Expression of Id-1 in ECs, ECs transduced with the empty LZRS retroviral vector, and ECs transducedwith LZRS-LANA. ECs transduced with the empty LZRS retroviral vector had a 2.0-fold increase in Id-1 expression compared to that of control ECs, while ECs transduced with LZRS-LANA had a 46-fold increase compared to control ECs. (D) Expression of Id-1 in ECs, ECs transduced with LZRS-LANA, and KSHV-infected ECs (EC +KSHV). ECs transduced with LZRS-LANA had a 68-fold increase in Id-1 expression compared to that in control ECs, while KSHV-infected ECs had a 70-fold increase compared to control ECs. In each panel, the blot was probed for expression of Id-1 and reprobed for actin to demonstrate equal loading of the proteins. A representative experiment is shown. At least three independent experiments were performed and gave similar results.

