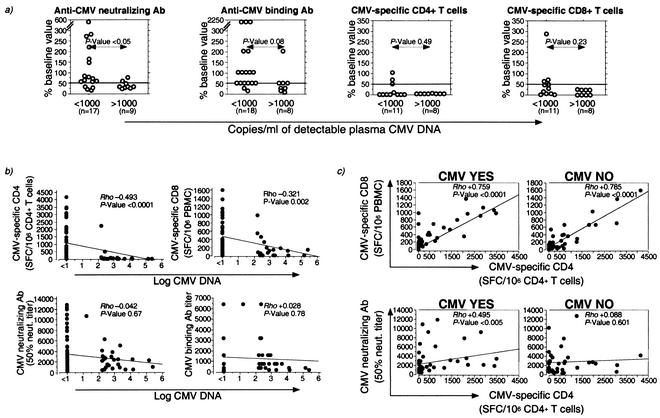
FIG. 3.
Relationship between CMV load and CMV-specific humoral and cellular immune responses in SIV-infected rhesus macaques. (a) Relationship between decline in CMV-specific immune parameters and detection of <1,000 or >1,000 copies of detectable CMV DNA per ml of plasma. A cutoff value of 50% decline is demarcated on each plot. n denotes the number of time points for which a CMV-specific immune parameter measurement was available. The Fisher exact probability test was used for comparison of differences in frequency of decline between the two groups. (b) Relationship between plasma CMV DNA and the frequency of CMV-specific T lymphocytes or titers of anti-CMV Ab. (c) Relationship between CMV-specific CD4+ T lymphocytes and CMV-specific CD8+ T lymphocytes or anti-CMV neutralizing Ab. Rho and P values were determined by the Spearman rank correlation coefficient test.

