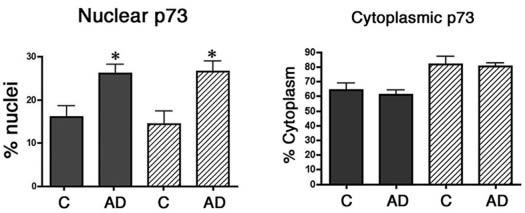
Figure 2.

The percentage of pyramidal neurones exhibiting p73 in the nucleus and cytoplasm of control (C) and Alzheimer disease (AD) brain. Pyramidal neurones within the CA1 and CA3 regions of the hippocampus were scored for the presence of p73 in the nucleus and cytoplasm as described in the section ‘Materials and methods’. Data represent the mean ± SEM for each group. Asterisks indicate significant difference in nuclear p73 between the control and AD groups (P < 0.008 for both CA1 and CA3).
