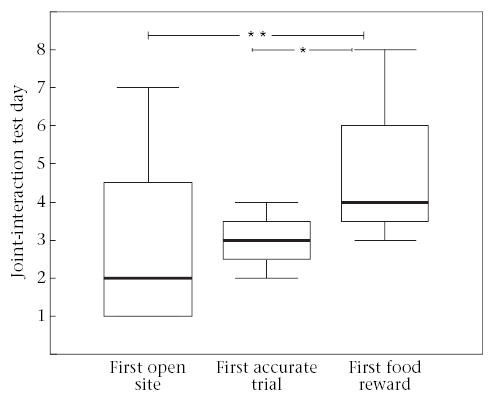
Figure 5.

Number of days taken for joint-interaction tamarins (N = 8) to first achieve different phases of the task. Boxes represent the inter-quartile range containing 50% of the values. The line across the box represents the median value. The whiskers extend to the smallest and largest values (excluding outliers). *P < 0.05; **P < 0.01.
