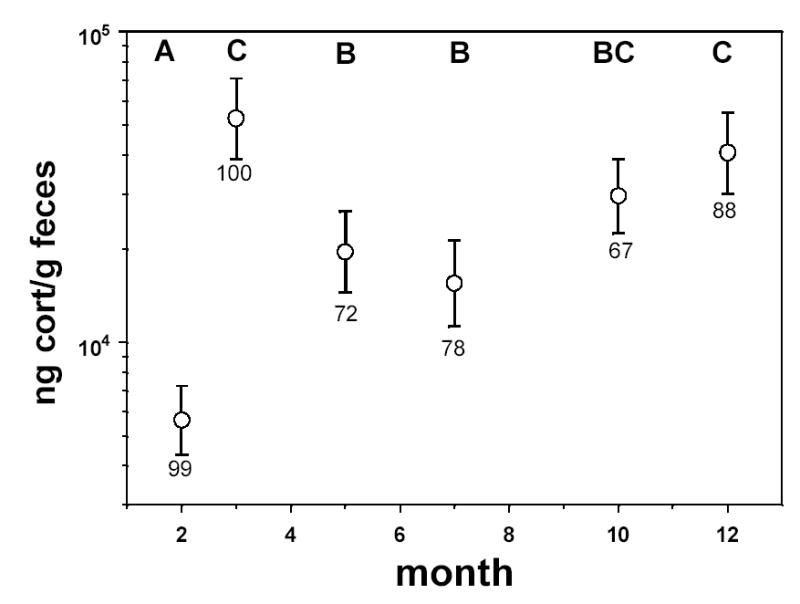
Figure 3.

Seasonal variation in fecal corticosterone concentrations (least squares means ±SE) under closed-economy aviary conditions (note log scale on Y axis). The six symbols represent 6 experimental sets of birds: set 0 is month=2, sets 1–4 are months 5–12 respectively; set 5 is month 3. Note that these values represent means across all sites (see Results). Letters above each symbol represent the results of multiple comparisons tests; symbols with different letters are significantly different from one another at α=0.05. Seasons in the text are winter (December – January), spring (February–May), summer (July–September), and fall (October–November). Sample sizes are given under each error bar.
