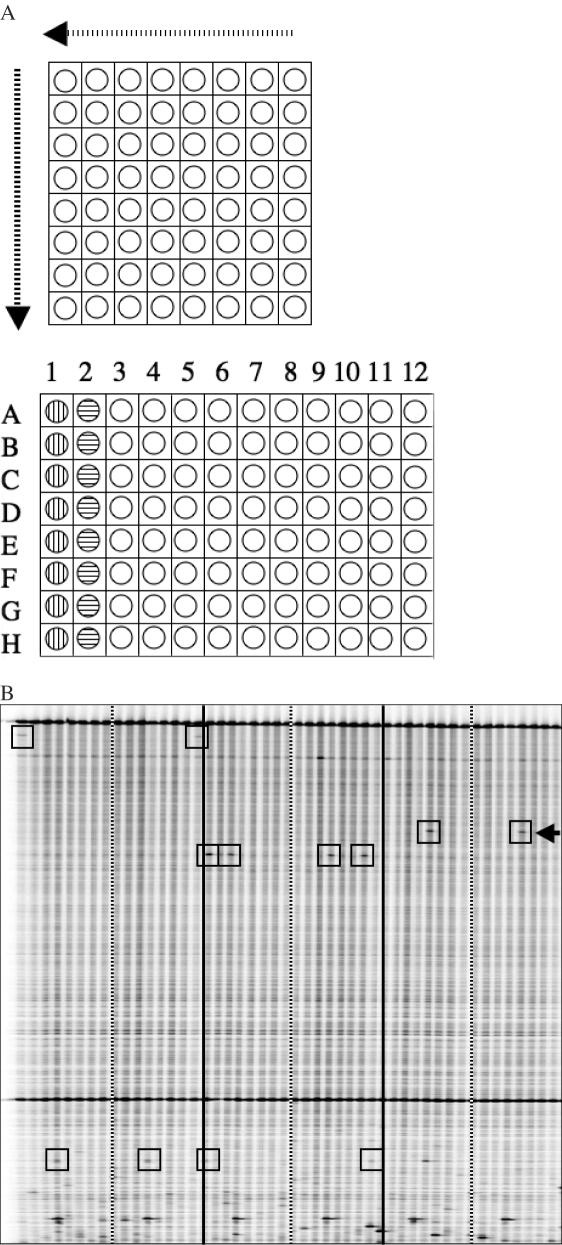
Figure 2.
Ecotilling of pooled samples to discover rare nucleotide changes. (A) Schematic diagram of sample pooling and arraying. A 2D arraying strategy is used whereby 64 unique samples are first arranged in an 8 × 8 grid (upper panel), pooled by row, and deposited into a 96-well screening plate (vertical striped wells, lower panel). Samples are then pooled by column and deposited in the adjacent column of the 96-well plate (horizontal striped wells). Each well in the 96-well plate contains eight pooled samples. Per set of 64 samples, an individual sample is present only once in a row pool and only once in a column pool. Samples are robotically loaded onto gels with sample A1 in lane 1, B1 in lane 2, A2 in lane 9 and so on. A true nucleotide change present in one of the first eight lanes must be present again in one of lanes 9 through 15. The exact lane numbers provide the coordinates to determine the individual harboring the nucleotide change. A total of 384 unique samples can be assayed per gel run. (B) Example of a pooled Ecotilling image (IRDye 700 shown). The first 48 of 96 lanes are shown from this run screening for polymorphisms in the DCLRE1A gene. Individuals screened in Figure 1 lanes 1–64 are rescreened in pooled lanes 1–16. Lanes to the left of the striped bars are row pools, and to the right are the corresponding column pools from a set of 64 samples. Solid black lines separate sets of 64 unique samples. Rare polymorphism are boxed. The arrow indicates a rare nucleotide change that was not found in the first 96 individuals screened (First two sets of lanes and Figure 1).

