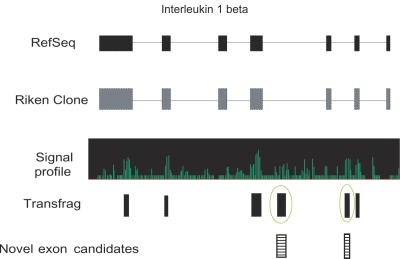
Figure 3.
Selection of novel exon candidates. IL-1β locus is shown as an example. Exon structures of RefSeq, RIKEN full-length cDNA clone and transfrags from tiling array experiments are aligned. Profile of signal intensity by tiling array is shown in the middle. Exons and introns are represented by closed boxes and lines. The transfrags were generated from the array data at signal intensity 7.4. The transfrags which did not overlap with any known exonic regions were considered as novel exon candidates (striped boxes).

