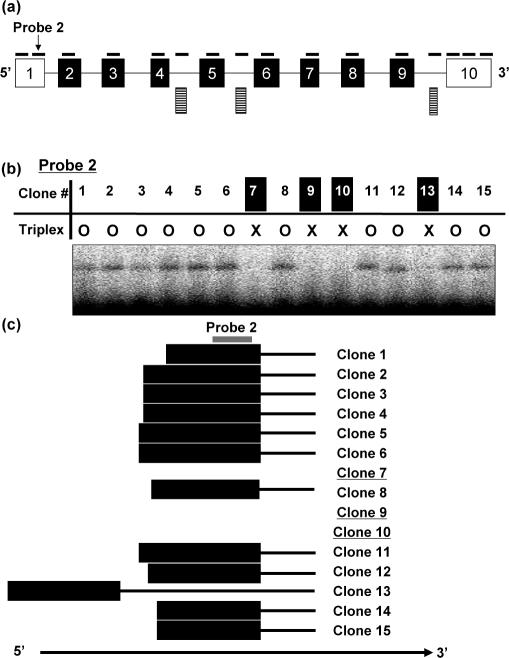
Figure 4.
Exon profiling in the Txndc5 locus. (a) Exon structure of a known clone (GeneID: 105245) in the Txndc5 locus is represented in arbitrary scale. Boxes and lines represent exons and introns, respectively. Closed boxes indicate the region of protein-coding sequence. Solid lines above exonic regions indicate probes. Striped boxes represent novel exon candidates. (b) Typical result of RecA-mediated exon profiling method. The result using probe 2 designed on the first exon is represented. In the table, circles and crosses indicate presence and absence of the triplex formation, respectively. (c) Schematic presentation of the first exons of Txndc5 clones. To clarify the figure, 15 clones were randomly selected. The probe 2 designed on exon 1 is indicated with the line in gray. The clones 7, 9 and 10 with underlines were proved to use an alternative exon downstream as a first exon.

