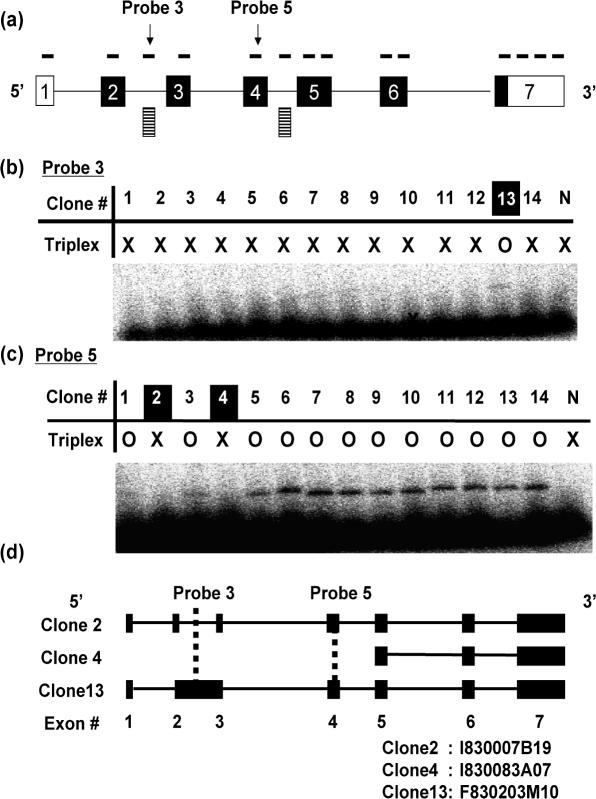
Figure 5.
Exon profiling of IL-1β. (a) Exon structure of a representative clone (GeneID: 16176) in IL1-β locus. Boxes and lines represent exons and introns, respectively. Closed boxes indicate the region of protein-coding sequence. Solid lines above exonic regions indicate probes. Striped boxes represent novel exon candidates. (b) Typical result of RecA-mediated exon profiling method. The probe 3 was designed on a novel exon candidate. Circles and crosses indicate the presence and the absence of the triplex formation, respectively. (c) Typical result of RecA-mediated exon profiling method. The probe 5 was designed on a known exon (exon 4). (d) Exon structures of three alternative splice candidate transcripts (clones 2, 4 and 13). Closed boxes and lines indicate exons and introns, respectively. The clone IDs for the clones 2, 4 and 13 are indicated at the bottom.

