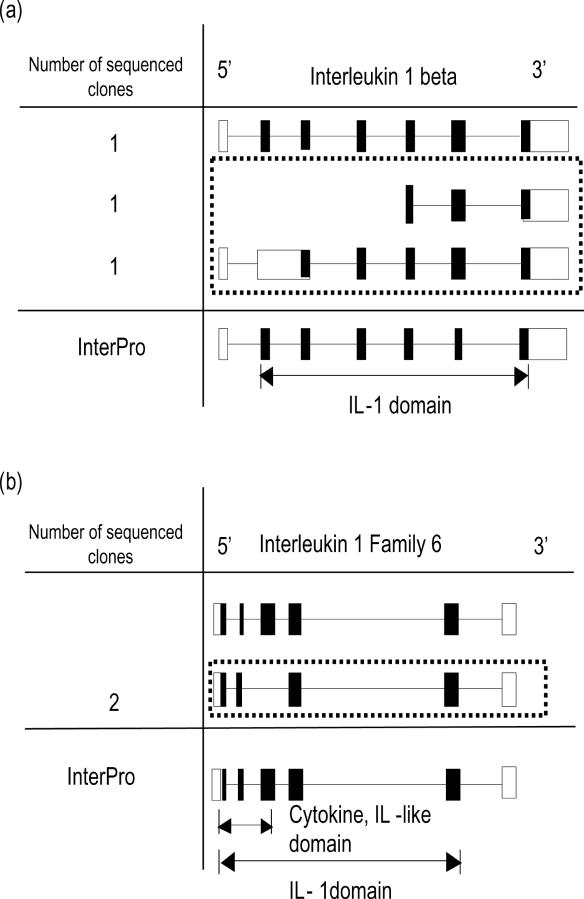
Figure 6.
Exon structures of known transcript and of sequenced alternative splice variant candidates. Known transcript is represented at top. Boxes and lines represent exons and introns, respectively. Closed boxes indicate the region of protein-coding sequence. Squares with dotted lines indicate genuine alternative splice variants. Positions of domains predicted by InterPro are indicated with double-headed arrows. (a) In IL1-β locus. (b) In IL-1F6 (GeneID: 54448) locus.

