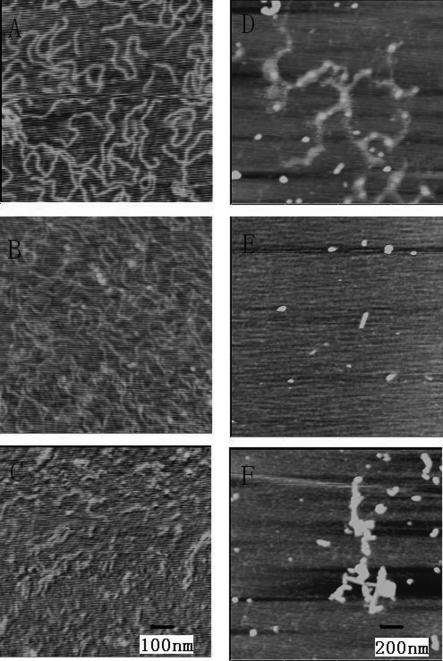
Figure 1.
DNA AFM images in the absence or presence of SWNTs: (A) GC-DNA alone; (B) ct-DNA alone; (C) AT-DNA alone; (D) GC-DNA + 40 µg ml−1 SWNTs; (E) ct-DNA + 40 µg ml−1 SWNTs; (F) AT-DNA + 40 µg ml−1 SWNTs. The DNA concentration used in all experiments was 19.5 µg ml−1. All the AFM images are captured on freshly cleaved mica. The image for (A–C) is 500 nm × 500 nm and the same scale bar. The image for (D–F) is 1 µm × 1 µm and with the same scale bar.

