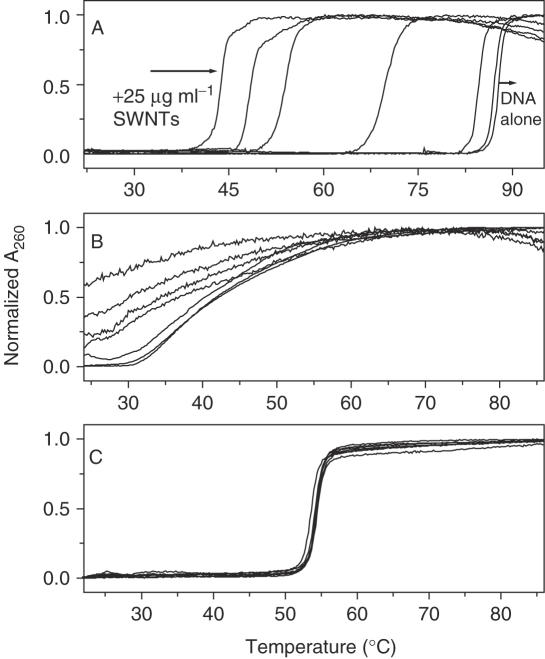
Figure 2.
UV melting profiles of DNA: (A) poly[dGdC]:poly[dGdC], (B) ct-DNA, (C) poly[dAdT]:poly[dAdT] in the absence or presence of SWNTs. From right to left: 0, 1, 5, 10, 15, 20, 25 µg ml−1 SWNTs in pH = 7 solution. Normalized absorption changes at 260 nm were plotted against temperature. The data were collected at a heating rate of 0.5°C min−1. Details see Materials and Methods.

