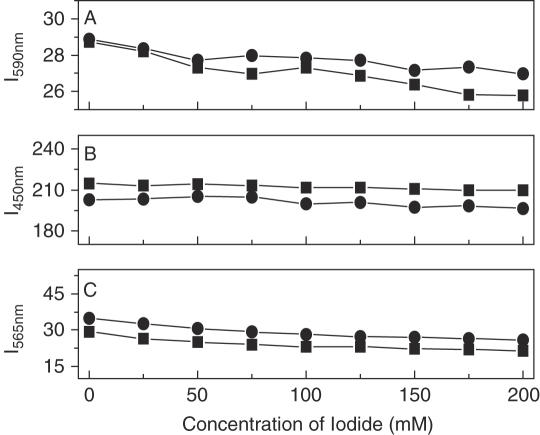
Figure 6.
Plot of fluorescence intensity of fluorephore-DNA (squares) or fluorephore-DNA–SWNTs (circles) versus NaI concentration. The ionic strength was kept constant: (A) 10 µM EB (Excitation wavelength: 480 nm, Emission wavelength: 590 nm Slit: 5 nm); (B) 10 µM Hoechst 33 258 (Excitation wavelength: 355 nm, Emission wavelength: 450 nm Slit: 3 nm); (C) 10 µM DM (Excitation wavelength: 480 nm, Emission wavelength: 565 nm Slit: 10 nm). Experimental details described in the experimental section.

