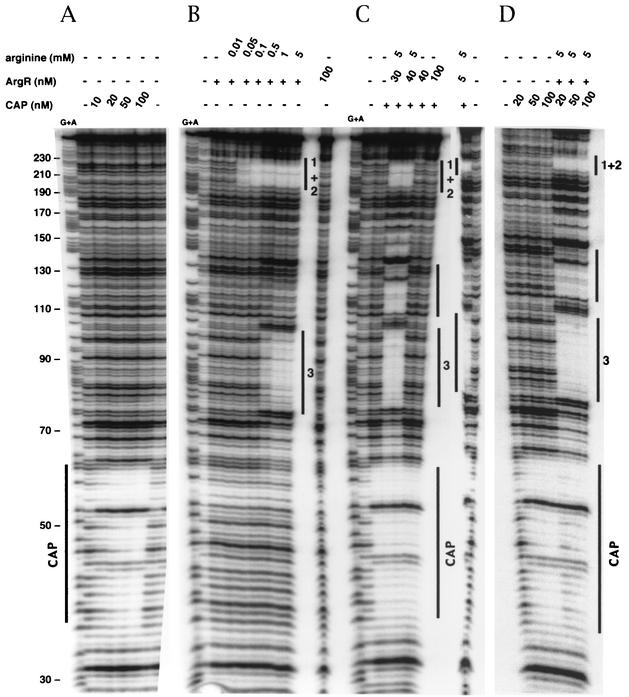
FIG. 4.
Analysis of CAP- and ArgR-binding sites in the argG and metY promoter region by DNase I footprinting assays. The labeled DNA fragment represents the coding strand of argG with cAMP-CAP complex alone (A), with 5 nM ArgR alone (+) (numbers correspond to ARG boxes) (B), with 100 nM CAP (+) and then with ArgR (C), and with 20 nM ArgR (+) and then with CAP (D). Protected regions are marked by solid lines. The coordinates were determined with G+A and correspond to the numbering used in Fig. 5. −, no protein was present.

