
Figure 4.
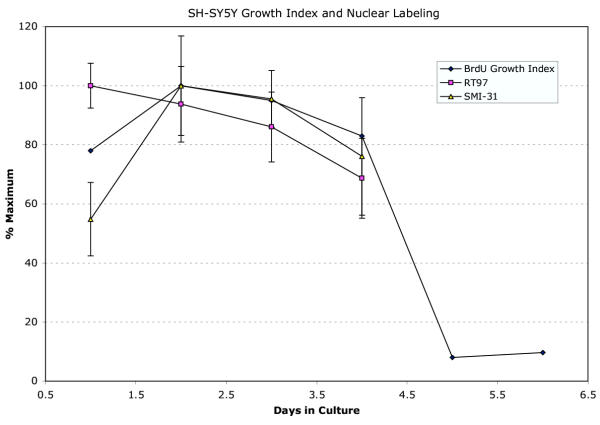
Graph showing a strong correlation between the culture proliferation index (percent nuclei showing BrdU incorporation) and the extent of nuclear labeling as a function of days in culture for SH-SY5Y cells immuno-stained for SMI-31, RT97. Values for SMI-31 and RT-97 labeling represent averages (± SEM) of the percentage of nuclear area labeled as determined by confocal projection. Proliferation index data is shown through day 5 and 6 to illustrate that the culture enters a confluent, stationary phase. See also Figure 1G,1H and 1I.