
Figure 8.
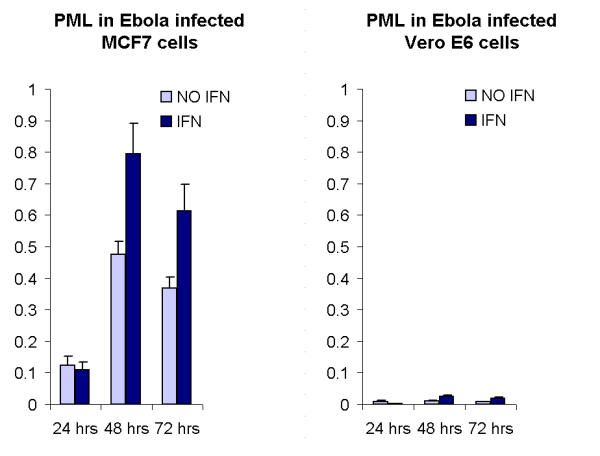
MCF7 and Vero E6 differs in the virus- and interferon treatment-induced PML expression levels. The Y axis shows the relative fluorescence intensity. The columns represent the mean fluorescence intensity of PML staining per nucleus in interferon-alpha treated cultures. Standard deviation is calculated from three independent capturings of random fields of immunostained cells.