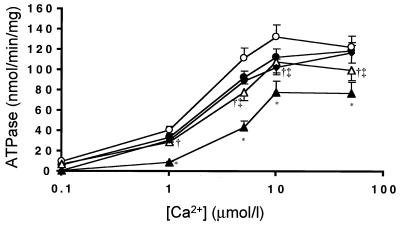
Figure 3.
ATPase activity measured vs. [Ca2+] in membrane preparations from control uninfected sham rats (n = 6, ♦), sham rats infected with Ad.βgal (n = 7, ●), sham rat hearts infected with Ad.SERCA2a (n = 8, ○), preparations from failing rat hearts infected with Ad.βgal (n = 8, ▴), and preparations of failing hearts infected with Ad.SERCA2a at day 2–3 (n = 9, ▵).

