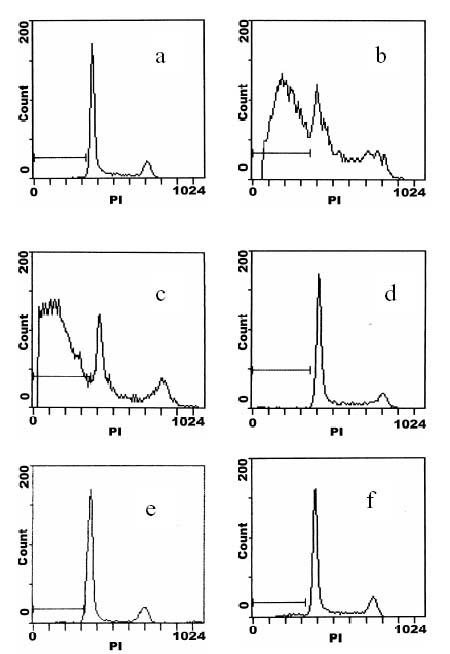
Figure 1.

Flow cytometry histograms of A549 and A549/DDP cells treated with a clinical dose of 30 μM cisplatin. a, b, c stands for A549 cells treated and cultured for 0, 24, and 48 h, respectively, and d, e, f for A549/DDP cells under the same conditions.
