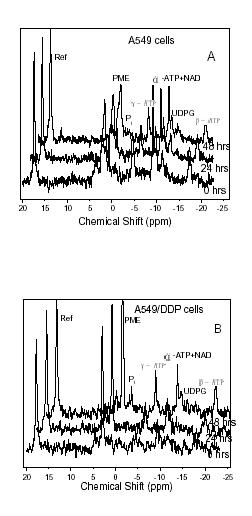
Figure 3.

31P-NMR spectra of A549 cells (A), A549/DDP cells (B) treated with a clinical dose of 30 μM cisplatin and cultured for 0 h, 24 h, and 48 h. The cell concentrations are comparable (5 × 10⁸ cells/mL) for each sample. The peak assignments are shown in the figures. 2000 transients were accumulated for each spectrum.
