
Figure 1.
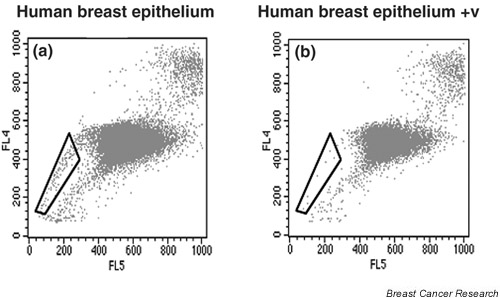
Flow-cytometric analysis of human breast epithelial cells stained with 5 μM Hoechst 33342. (a) Trace demonstrating the presence of a side population (box). (b) Addition of 20 μM verapamil (+v), resulting in a 12-fold reduction in the side population. X axis, Hoechst red fluorescence intensity (FL5); Y axis, Hoechst blue fluorescence intensity (FL4).