
Figure 2.
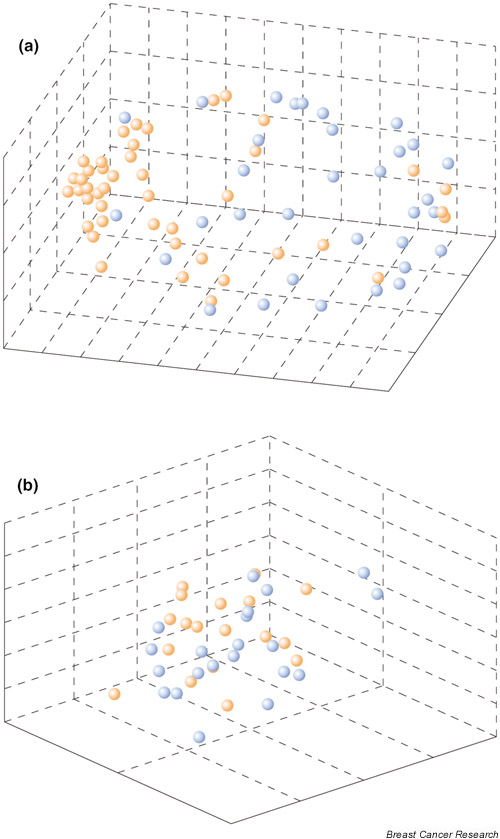
Multidimensional scaling (MDS) clustering of gene expression data from breast tumors using 58 out of 231 genes from the outcome predictor gene set identified by van 't Veer et al. [7] that were also included in our array analysis. These genes retain their predictive value in those data but not in our independent patient sample. (a) Fifty-eight primary breast tumors (training set) from the study by van't Veer et al. and (b) 44 from our array study are plotted. Tumors with a poor prognosis (distant recurrences within 6 years) are colored blue and tumors with a good prognosis (no recurrences within a follow-up period of 5–14 years) are orange. MDS displays the position of each tumor sample in a three-dimensional euclidean space, with the distance between the samples reflecting their approximate degree of correlation [11].