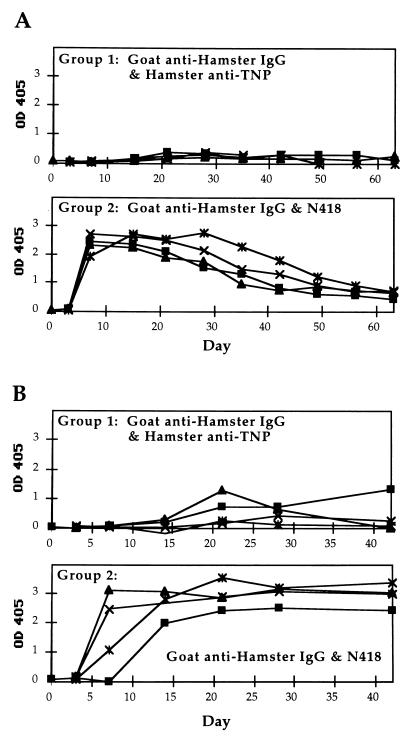
Figure 6.
Time course of IgG anti-goat responses in mice that received separate injections of hamster and goat antibodies. Each group consisted of 4 mice. (A) IgG response of individual CBA mice. Group 1 was given 0.5 μg each of goat anti-hamster IgG and hamster anti-TNP antibodies. Group 2 was given 0.5 μg each of goat anti-hamster IgG antibody and mAb N418. The data points shown for day 0 correspond to sera obtained before immunization. Postimmunization serum samples were collected on days 3 and 7, followed by weekly collections. (B) IgG response of individual BALB/c mice. Data presented as described for A.

