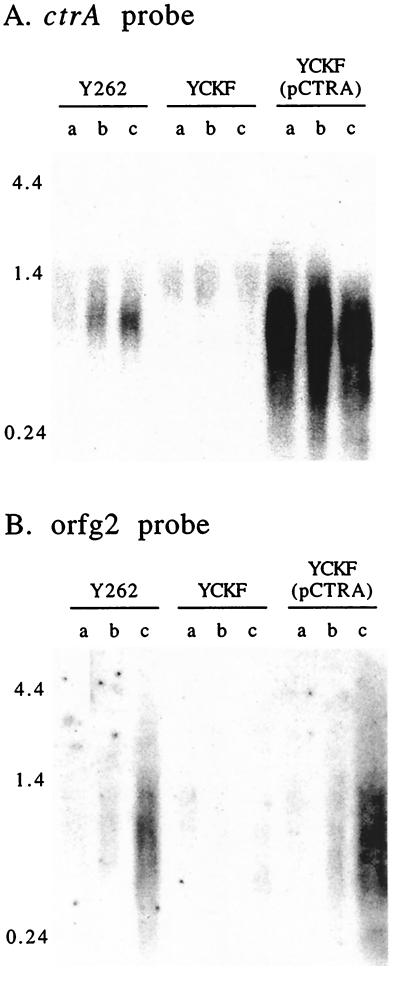
Figure 5.
RNA blot analysis of GTA gene transcripts. RNA was isolated from the strains indicated above the lines at three time points over the growth cycle: a, b, and c represent mid-log, late-log, and early stationary phases, respectively. Equal amounts (10 μg) of RNA were loaded in each lane. Approximate locations of molecular weight RNA standards are shown on the left (in kb). (A) Results when the blot was probed with a fragment of ctrA. (B) Results when the blot was probed with a fragment of orfg2.

