
Figure 5.
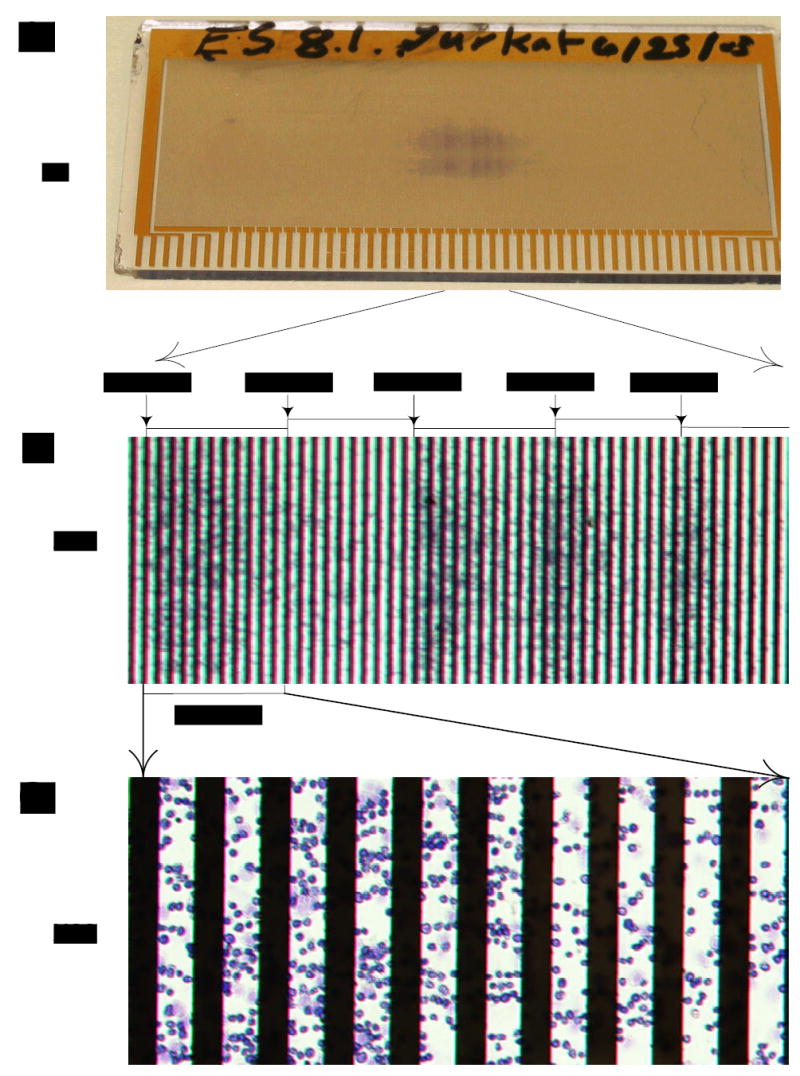
Electrosmear result for Jurkat cells revealing banding pattern and heterogeneity in the cells. (A) Photograph of the electrosmear slide, showing the gold contacts that were energized by different frequency signals and the trapping distribution of the cells. (B) A 10X magnification of the trapping zones for the Jurkat cells, revealing that cells having slightly different DEP properties were trapped on different groups of electrodes corresponding to different DEP excitation frequencies. (C) An 80X magnigication of the subpopulation of Jurkat cells that were trapped in the 114 kHz region of the electrosmear slide.