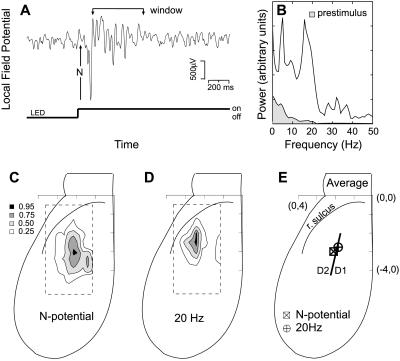
Figure 3.
Spatial localization of the visually induced electrical response. The stimulus was a step of illumination from a green light-emitting diode (LED; parameters as in legend to Fig. 2). (A) Example of the surface potential in response to a single step. Note the initial negative-going spike (N-potential) and the subsequent fast oscillations that persist for up to 1 s. The epoch marked “window” corresponds to a 0.5-s poststimulus interval. (B) Power spectra of the “window” epoch in A. Note the stimulus-induced peak near 20 Hz, as well as the increased power at lower frequencies compared with a 0.5-s prestimulus window. The bandwidth of the spectral estimate (full width at half-maximal amplitude) was 4 Hz. (C) The locus of amplitudes of the N-potential. The gray-scale contours correspond to fractions of the maximal response. The spatial coordinate system originates at the medial line and the rostral edge of cortex. (D) The locus of response for the 20-Hz oscillatory band. (E) The trial-averaged centroids for the N-potential and 20-Hz oscillation band are shown relative the anatomical border between dorsal regions D1 and D2 (line); n = 6 animals.

