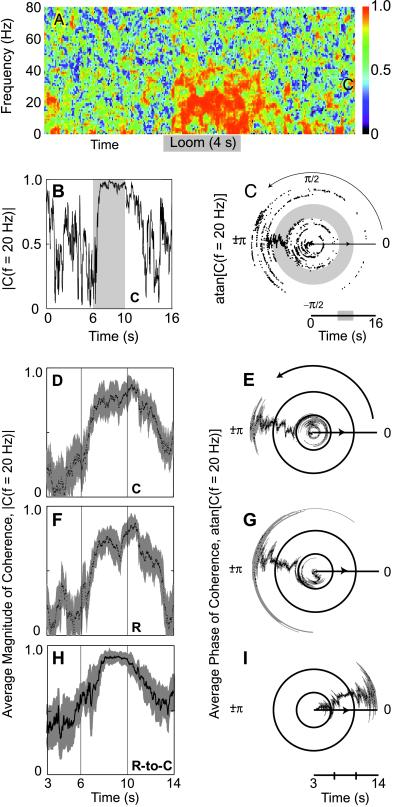
Figure 5.
Spectral coherence of the current source density between intra- and interradial locations. (A) The magnitude of the coherence between the upper source/sink pairs of the caudal of two Si-based arrays (100 μm and 200 μm in Fig. 4C) calculated from single-trial data as a function of frequency and time. The temporal window was 1 s and the bandwidth was 4 Hz. (B and C). Detailed view of the coherence calculation in A for the 20-Hz band. Shown is the magnitude, |C(f)|, and phase, arctangent [Im(C(f))/Re(C(f))], for f = 20 Hz. The gray band indicates the period of the looming stimulus. Note the high coherence during stimulation and the phase shift of near π radians between source/sink pairs. (D and E) The trial-averaged (n = 16) magnitude and phase of the coherence for the upper source/sink pairs of the caudally located array. The black line is the mean response, and the gray bands define the standard deviation. (F and G) The trial-averaged magnitude and phase of the coherence for the upper source/sink pairs of the rostral array. (H and I) The trial-averaged magnitude and phase of the coherence between the uppermost sources of the rostral and caudal arrays. Note the significant phase shift of +0.53 radians.

