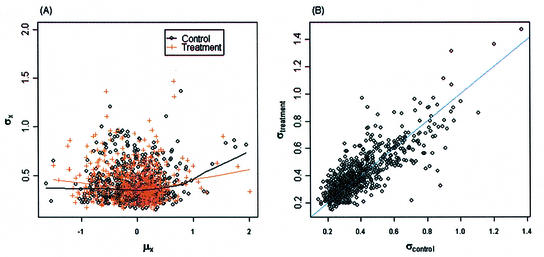
Figure 2.
Scatterplots for the example data set after a normalization. (A) Mean intensity versus standard deviation plot for control and treatment samples. There is no apparent relationship between the mean and standard deviation for the normalized log-intensity data. (B) Standard deviation plots of the control versus treatment. The standard deviations between the two groups are approximately equal.

