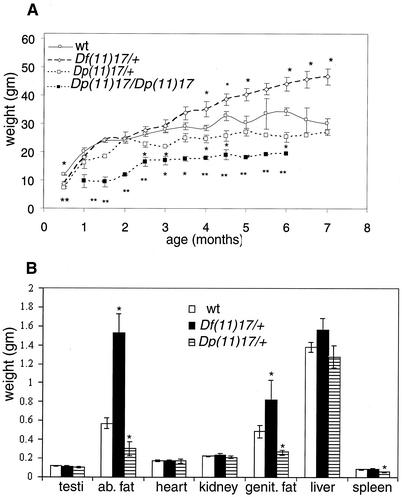
FIG. 5.
(A) Weight curves for Df(11)17/+, Dp(11)17/+, Dp(11)17/Dp(11)17, and wild-type (wt) male mice are presented. Each point represents the average of 10 weights, with error bars indicated. (B) Different organs and body fat (ab. fat, abdominal fat; genit. fat, genital fat) from mice with the indicated phenotypes were weighed, and each bar represents the average of results for 10 samples. Error bars are indicated. *, P < 0.05; **, P < 0.01. Asterisks representing P values appear on top of or below each time point for which significant differences were found.

