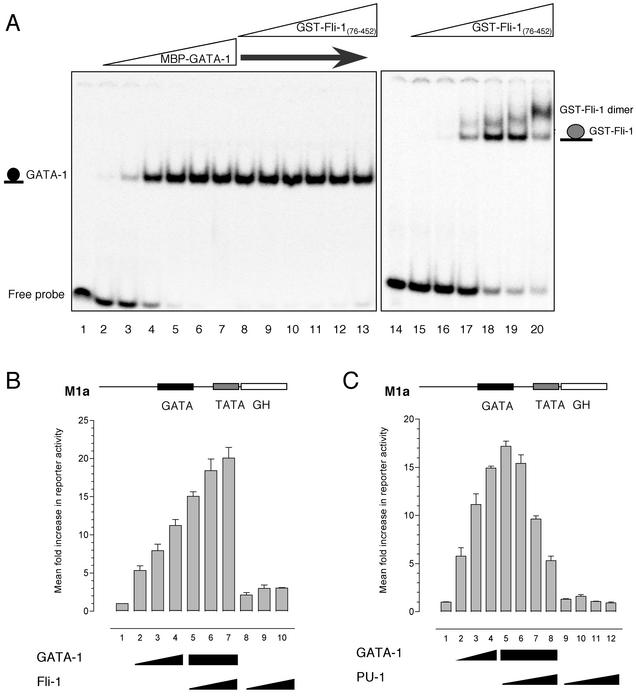
FIG. 4.
Fli-1 does not antagonize GATA-1 DNA binding or transcriptional activity. (A) EMSA was performed by titrating increasing amounts of purified recombinant MBP-tagged GATA-NC with 0.2 fmol of the 32P-labeled GATA consensus oligonucleotide 5′-GATCTCCGGCAACTGATAAGGATTCCCTG-3′ (sense strand; Crossley et al. [8]) (the GATA site is shown in bold). The first lane contains probe alone. Lanes 2 to 17, increasing concentrations of GATA-1 protein (4 × 10⁻¹³ M to 4 × 10⁻⁸ M). Lanes 8 to 13, 4 × 10⁻⁹ M GATA-1 with increasing amounts of GST-Fli-1 protein (8 × 10⁻¹² M to 8 × 10⁻⁷ M). Lane 14, GPIX-Ets probe alone (5′-ATTTTCATCACTTCCTTCCGCCCGCTCCC-3′, sense strand; Eisbacher et al. [9]). Lanes 15 to 20, increasing amounts of GST-Fli-1 protein (8 × 10⁻¹² M to 8 × 10⁻⁷ M) in the presence of GPIX-Ets probe. (B) HeLa cells were transfected with 400 ng of M1α reporter alone (bar 1) or together with expression plasmids for GATA-1 alone (bars 2 to 4, respectively, 100, 200, and 400 ng); 400 ng of GATA-1 in combination with increasing amounts of Fli-1 expression plasmid (bars 5 to 7, respectively, 100, 200, and 400 ng); or increasing amounts of Fli-1 expression plasmid alone (bars 8 to 10, respectively, 100, 200, and 400 ng). Growth hormone levels were assayed after 48 h. Values are expressed as mean fold increase ± standard deviation relative to a value of 1 for each reporter. Results shown are means from three experiments performed in triplicate. (C) HeLa cells were transfected as described for panel B, except that Fli-1 was replaced with PU.1. Bars correspond to 400 ng of M1α reporter alone (bar 1); expression plasmids for GATA-1 alone (bars 2 to 4, respectively, 100, 200, and 400 ng); GATA-1 in combination with increasing amounts of PU.1 expression plasmid (bars 5 to 8, respectively, 100, 200, 400, and 800 ng); or increasing amounts of PU.1 expression plasmid alone (bars 9 to 12, respectively, 100, 200, 400, and 800 ng).

